Friday, December 26, 2014

VRL Logistics- Should you buy into the IPO?


VRL Logistics is a travel company that has two major sources of Revenue

  • Parcel Delivery Services that contribute to about 75% of its Revenues
  • Bus Travel Services that contribute to about 25% of its Revenues
VRL logistics has been growing at a CAGR of 20% in the last 4 years but its growth has slowed down in the past due to less demand of deliveries from the Industry because of slow growth. It has been seeing a growth of 7-8% in the past two years

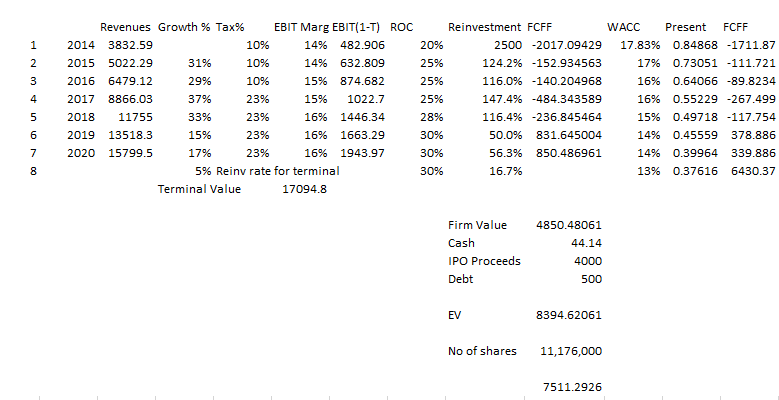
My valuation for the company can be found here where you can download and change the numbers if you believe in a story that is different from mine for the company. All numbers are in INR Million

  1. WACC- I found the cost of debt taking a weighted average of all the loans and the rate of interest they were taken at. The weighted cost of debt came to be 13.2%. I took the average beta of the 10 transportation companies in India which was 1.1. The risk free rate is 8%(Present 10 yr government bond yield) and the equity risk premium is 8.3% (Using ERP=CDS*Std Dev of Equity Market/Std Dev of Bond Market| CDS=2.3% Multiplier =1.5 Mature Market Risk Premium =5%) WACC came to 13.72% which I increased slowly to 15% at the terminal value because I expect an increase in equity value
  2. Revenues- I have assumed that the revenues keep growing at the same rate of 8-9% , the analysts estimates in the growth rates of logistics sector are around 10% because of muted growth of Industrial Production. These increase in revenues have to be backed by reinvestment rates
  3. EBIT Margins- Historically, the EBIT margins have been 13%-14% so I used the same margins, I have increased the margins for the next year to 16% because of decrease in its primary cost- fuel.  
  4. Reinvestment- I ran a regression on the Revenues vs Number of transportation vehicles in the past. I then extrapolated this regression to the number of buses that should be increased in case of the expected increase in revenues. Right now, VRL is using Rs 831 Million to purchase 350 new goods transportation vehicles. So using this as a background figure I calculated the reinvestment and added a 5% of the EBIT(1-T) as reinvestment for repairs/upgrades/warehousing upgrades. The reinvestment rate I have used is 40% on average and 35% at the terminal value.
  5. Terminal Growth - I calculated the terminal value with a 6% growth rate and a reinvestment rate of 35%
  6. To the operating value, I added the IPO Proceeds, added cash and subtracted the debt to get an enterprise value. The existing number of shares are 85,536,162 which gave a value per share of Rs 187.55
So depending on the increase in number of shares, the value per share would be increased which you can change on the excel sheet to calculate the intrinsic value per share to decide on if you should buy into the IPO

Wednesday, December 24, 2014

The Valuation of the Indian E commerce Industry

Flipkart got a new valuation- $11 Billion. It raised a fresh $700 Mn from investors at this valuation. Just to put things into perspective, this is 20 times the valuation of the Future Retail which is a brick and mortar chain and sells the same things Flipkart sells online, much more merchandise actually. 

Traditional DCF valuations for the E commerce industry is hard to perform because of the unknown amount of data. Since these are unlisted companies and they are very protective of their data, predicting their margins,growth, reinvestment would be a impossible task.

This takes us to the Relative Valuation method, the method that VC investors use to come up with these valuations. Relative valuation looks at previous transactions and valuations of competitors who are in an identical phase, identical cost of capital, identical revenues, identical growth rate, identical margins, so on. In reality, it would be impossible for two different companies to have identical characteristics but in the presence of less data, this is the method that gives us an estimate of how much we the asset can be priced depending on how someone else bought it for (Relative Pricing)

For a young firm, the most common metric used is EV/Sales. For firms that have reached a maturity period the metric used is EV/EBITDA but for a young firm, margins would be tough to predict so EV/Sales are used. 

Let's have a look at the EV/Sales ratios of Ecommerce industries around the world.
Market Cap
Revenue (USD Mn)
EV/S
Company
US$M
2013
2014
2015
2013
2014
2015
US (Mean)


2.68
2.31
1.99
Amazon
170722
74453
90581
110243
2.29
1.88
1.55
Ebay
76569
16047
18268
21059
4.77
4.19
3.64
Shutterfly
2070
784
923
1059
2.64
2.24
1.95
Blue Nile
461
450
498
549
1.02
0.93
0.84


CHINA


Dangdang
1337
1039
1243
1451
1.29
1.08
0.92
Alibaba
262290
5553
8447
26

Other than Alibaba, the US mean is around 2.31. From the data Damodaran has shown on his website here , the EV/Sales for US internet retail is 3.31.

Let's look at the EV/Sales ratios firms are trading at in India. 
Here, Sales represents the GMV or Gross Merchandise Value sold through the websites. GMV is a term used in online retailing to indicate a sales value sold through an online website in a particular timeframe. This is the value the supplier lists his merchandise on the website at and the discounts that the online websites give out on their own is their own loss and doesn't add to the GMV.

If the value of a shirt is Rs 1200 as listed by the supplier, let's say Lee and some consumer buys this shirt through Flipkart for Rs 1000 for a Rs 200, the GMV sold is Rs 1200 and the Rs 200 is Flipkart's own losses. 

Flipkart has supposedly reached a $3 Billion GMV and is looking at a $4 Billion GMV by March 2014. At a $3 Billion GMV, and a pre money valuation of $10.3 Billion (Flipkart raised $700 Mn in the fresh round), its EV/Sales ratio works out to be 3.43 which is around the average EV/Sales ratio for US internet retail.

Amazon's EV/Sales ratio is roughly around 2-2.5 and this is considered a standard in the industry as a good valuation for EV/Sales. Most likely, Flipkart commanded this premium because of the expectation that it will reach a $ 4 Billion GMV pretty soon. At a $4 Billion GMV, the EV/Sales ratio will be around 2.5.

But these valuations show a difference between Snapdeal and Flipkart. Snapdeal got a valuation of $3 Billion (rumored) when Softbank invested $670 Mn. Snapdeal crossed the $ 2 Bn GMV in November so it has an EV/Sales ratio of 1.5 which is quite less compared to the industry standard.
 This implies that the investors of Snapdeal snapped it at a tasty valuation and will yield higher returns on their investments. If you are an investor with AUM higher than $ 10 Bn, you know where to invest now !

A better metric would be to look at the Enterprise Value per user as this might give a better chance to view how many users are registered to each website and can give us a better indication of the value. This would help because Alibaba would typically have higher number of users registered onto it commanding its high valuation.

Number of users
Amazon 244 Million
Alibaba 618 Million
Snapdeal 20 Million
Flipkart 22 Million

This gives an EV/user of
Amazon- 560
Alibaba- 275
Snapdeal - 150
Flipkart- 468

Even looking at these metrics, Snapdeal comes across as a relatively undervalued company as of now and looking at the business models, Snapdeal is going to break even in a relatively quicker time because of its pure marketplace model while Flipkart is going to burn cash for a long time 

Thursday, December 11, 2014

Just Dial - The lnternet Wannabe?

Mint published an article Justdial: The Internet Wannabe on Nov 25th where the writer argues that Justdial is one of the Indian companies which wants to latch onto the internet boom on similar lines of Flipkart, Zomato but fails to do so because JD only saw a glacial growth of 27% last year. While there's no explosive growth, I felt that if JD was able to convert revenues into profits much better than Flipkart will be able to, that's still a stock to watch out for. I valued this company around Nov 26th and it has been hanging in my drafts till now.

Just Dial is a local search engine that has listings of sellers and services vendors and provides this list of information to sellers. It had 11.8 Million Listings on its server and 37 Million ratings and reviews by users in 2014. It offers these services by multiple platforms


My valuation for the company is attached here and you can make any modifications you want to get a value which you believe is the right value. My belief in the growth may be different from another so valuation becomes a user dependent entity especially for some company like JD which is still in the growth phase and has few comparables.

  1. For revenues, I looked at the different sources of subscribers JD has which I have picked up the Annual Report. I posted the screenshot above. These three different types of searches would grow at different rates in the future. Mobile Internet is going to grow exponentially while SMS searches and PC internet rates would stagnate. In JD's annual reports, Avendus reports of the market such as projected Cell phones were given. Also CAGR growth rates of the three different bases were also attached picked up from reports. Using the growth rates directly given in their own annual report is not an ideal method but this was the best alternative for growth I had and if I used other growth rates such as cell phones, I would be missing out on PC internet searches. And using these growth rates would give me a base value over which I could later work on. The given growth rates were Mobile Internet- 174%, PC Internet- 32%, SMS- 21%. I used these growth rates over the existing customer base of JD and projected this upto 2018.
  2. I looked at the revenues in the previous years as a ratio of searches and found that each search contributed to a revenue factor of 4. I estimate that this will remain the same, In future too, more the searchers, more the ad revenue and more interest by industries to showcase their services. So I used the searches I projected till 2018 to get revenues.
  3. The EBIT margin as a percent of revenues was around 25%-30% in the previous years so I assume that this will continue and I have used an EBIT margin of 27%- mainly as this is not capital intensive service and I believe such high margins are justified.
  4. JD is a debt free company. I took the cost of equity from Damodaran's WACC sheet which has a collection of all companies in different sectors and averages of different factors such as WACC and Beta. I took the average of cost of equity for the advertising sector from the sheet which was 12.21%
  5. The Tax Rate was around the range of 30% in previous years and since there is no high cost of depreciation JD is going to incur in future, I have used marginal tax rate.
  6. For reinvestment, from the news I found that JD is going to invest Rs 100 Cr for the FY 2014-15. I took reinvestment = Growth/ROC . The ROC of JD in the past was around 25-45%. In the initial years I estimated that ROC is 35% and slowly it will increase to 44% at terminal value because there will be less investment and it will be dedicated to improve the online website once the infrastructure is set in place
  7. For terminal value, I estimated a 10% growth, while I generally do not give such a high growth rate but if you believe in the Indian growth story, you are liable to believe in the internet growth story too and because of that, I am estimating a 10% growth rate for the terminal value.
  8. The Value of operating assets came to be Rs 9434 cr, to which adding the cash and bank balance comes to Rs 9471 Cr. Just Dial is a zero debt company.
  9. Dividing by the total shareholding, the value per share comes to be Rs 1349. JDs value was at Rs 1600 towards the end of november which was when the Livemint article came out but corrected itself sharply when an analyst gave a recommendation to sell with a target of Rs 1440-Source 
  10. Right now, at the time of writing this article, the value is at Rs 1382 which indicates the market price is near the fundamental value and buying this can result in a gain at a later point of time especially since JD is trying to enter other sources of revenue mainly the E Commerce market. 
  11. Personally, I am going to add it into my portfolio and see where it goes until the next earnings. I believe that for the next earnings, the market is going to react well so the price might increase and you can make a profit.


Friday, December 5, 2014

Manpasand Beverages: The "Juicy" IPO?


Manpasand Beverages is a non alcoholic beverages company which caters to the "Juice" beverages industry with its brand "Mango Sip". It has entered the market in 2010 and it believes in two years has acquired a decent market share of 4% of the total Juice Industry in India. It filed a DRHP with the SEBI on November 26th indicating its interest for listing.

I have valued the company post IPO factoring the Rs 4000 Million it plans to obtain through the IPO. I have stated my assumptions and the steps to value the company below. The valuation is available in this file which you can download while I take you through it.


  1. Discount Rate- The discount rate is split into Cost of Debt and Cost of Equity. According to the DRHP, the loans they have taken from the bank have come at a cost of bank rate+350 bps. I have assumed the same as the cost of debt as the interest coverage ratio is high and I do not see any reason for banks to increase the cost of debt later. The bank rate is 9% right now which adds up the cost of debt to 12.5%.                                                                                                   For the cost of equity, valuing beta was tough as there's no other comparables in the market, the big competitors Coke and Pepsi are unlisted in India, the small ones like Parle's Frooti are unlisted or have a lot of other businesses from which . So I took the average unlevered beta for beverages in the US market which is 1.24.  The current long term debt is Rs 261.32 million and the equity the firm is going to obtain from the IPO is Rs 4000 Million. This gives a D/E ratio of 93.8% equity to total
  2. The Industry overview section gives the analysis of an EuroMonitor report that predicts the future market value of the beverages industry and also the contribution of juice industry. Due to lack of better data, and to keep things simple, I will assume that the revenues projected in the report are a good measure. Out of this in the past 2 years, Manpasand Beverages has had a market share of 4.8%. I have assumed that Manpasand will slowly increase the market share in the fruits segment and will acquire 8.5% by 2020. This is because Manpasand has been increasing the portfolio products with products such as "Mango ORS". If you believe that it will not be able to sustain such a market share in such a competitive market change the values accordingly
  3. The Growth inherently came from the increase in the market share of the Juice segment. The Juice segment had a CAGR of 18%. I have assumed that by 2020 the market share will stabilise at 8.5% . I have assumed that the industry will keep growing at the rate of 5% accounting for India's high inflation state which I have incorporated into terminal growth.
  4. The EBITDA margins in 2013 and 2014 are around 15.5%. I have taken the same margins for all the years starting with 14% in 2014 and slowly increasing the margins to 16% by 2020
  5. The average ROC was a factor necessary for forecasting reinvestment. Since there were no comparables I took up Marico and saw its ROC shift around 28-35%. So in the initial years, I assumed an ROC of 20% which matched the reinvestment in the previous years and slowly took it up to 30% gradually.
  6. Looking at the valuation, Firm Value is Rs 8394 Mil. Adding cash of Rs 44.14 Million and IPO proceeds of Rs 4000 Million, removing the debt of Rs 500 Million, the Enterprise Value is Rs 19,928 Million. Dividing by the number of shares of 11,176,000 the value of each share is Rs 7511
  7. After finding out the dilution, this Enterprise value can be used to find out to find out the price per share and then decide if the price is a good deal before buying into it.
You can change values in the valuation sheet I have attached to make sure you come to a price based on the assumptions you are comfortable with by playing around with the valuation sheet. 


Here's the FCFF calculation attached as an image